In today’s distracted, digital world, visual content beats text simply because our brains process visuals 60.000 times faster. Real estate infographics are a powerful way to repurpose content, expand your reach, draw new referrals, and educate your audience.
The real estate world is highly visual. In this post, we’ll talk about how your real estate company can benefit from using real estate infographics and we’ll also share out top picks to get you inspired.
But first, let’s see what infographics are and why they are an essential part of your real estate marketing strategy.
The Deal With Real Estate Infographics
Infographics visual presentations of information that use the elements of design to display content.
Information + graphic = infographic.
According to Instant Shift, infographics consist of three main elements: visual, content, and knowledge.
#1. Visual
Color coding
Graphics
Reference icons
#2. Content
Time frames
Statistics
References
#3. Knowledge
Facts
A real estate professional can use real estate infographics to:
- Send a message to home buyers, sellers, coworkers, or anyone in the real estate world
- Share real estate information in an easy-to-understand way (useful information about the home buying process, the mortgage process, the down payment, the home loan types etc).
- Analyze real estate data (today’s housing market trends, evolution of home prices, home ownership rates etc).
Why Use Real Estate Infographics In Your Marketing Strategy
It’s fascinating how fast things change over the years. Our digitized lifestyle has made us speed-lovers—we want information that is visual, readable and easy to understand.
Real estate professionals work hard to create engaging content to promote their businesses, but they don’t always see it through their readers’ eyes.
Studies show that when we use relevant images, people focus more on watching them than reading the text. Plus, people following directions with text and illustrations do 323% better than people following directions without illustrations.
The impact visual content has on reach, engagement, and sales is undeniable. And the real estate world is highly visual, so it makes sense to say every brand can benefit from using real estate infographics.
Why?
First, because those who use infographics 12% faster than those who don’t. Sounds like a pretty good reason, right?
Second, they’re a great way to breathe life into old content and make it more popular. A list post you hoped would perform better can finally become a hit.
Third, they’re attractive and easy to digest. People love pics, facts and stats. Our eyes are naturally drawn to visual content and our brains are curious machines. We subconsciously search for great infographics on real estate blogs, in social media feeds, and in the real world.
Fourth, real estate infographics are ultra viral. They can be easily repurposed and shared across different channels.
Fifth, they are embeddable. As social marketing influencer, Jeff Bullas points out, “When designing, developing and publishing an infographic the code to put it on a WordPress blog or website is provided as an embed code. This then creates an automatic link from their site to yours.” Easy, peasy.
Sixth, they maximize real estate branding efforts. Creating infographics that have your real estate logo and brand name helps drive brand awareness.
Seventh, infographics are great for SEO. “The viral nature of the infographic medium makes people link to your website and Google will index it higher due to its “Page Rank” algorithm,” adds Jeff.
Clearly, there are many reasons why real estate infographics should be part of your marketing strategy. But simply using them without knowing their effectiveness is not a smart move. To find out the real value of your own infographics and truly have a firm grasp on their results, you need to run the numbers.
How To Track Results From Real Estate Infographics
According to President of InfoNewt, Randy Krum, the process of tracking an infographic starts the day we publish it. “Where many companies miss the mark with their infographics is in their tracking efforts after the infographic has been released. Pageviews, social shares, reposts, backlinks are all part of measuring the success of an infographic,” he told Huffington Post.
Randy shared five things you should focus on after publishing an infographic. Here’s a summary:
1. Your Landing Page for Analytics
Website analytics matter and any Realtor should know this. Landing pages offer relevant insights on web analytics like page views, traffic patterns and referring sites.
“To make sure you get the most out of your infographic, make sure it is published on the company’s website on a dedicated landing page […]. That will provide a dedicated landing page URL as the one primary link in posts to drive all the views and backlinks to one place,” says Randy.
2. Backlinks
One of the main reasons real estate companies use infographics is to attract links and visitors to their website. Keep in mind that “one strong link can be worth more than many weak links,” points out Randy.
You can use Google’s PageRank to check your links’ value. “Go through your list of industry-specific websites, blogs, and news media outlets you pitched the infographic to, and search their website to see if anything pops up (wait about a week or two before searching to give time for an article to be written),” suggests Randy.
3. Social Shares
Your social shares show how well your infographic content is performing online; plus, they build brand awareness and exposure.
Randy’s tip is to make sure you “use the counters from the social share buttons you set-up on the dedicated landing page. “Then he mentions you should “check your social media platforms for the full URL link to the landing page to find other social media posts that didn’t use your buttons but did link back to the infographic.” Last but not least, check how many shares you’ve got from sites that reposted the infographic.
4. Reverse Image Search
This is a tool you can use to find websites that posted your real estate infographic without linking back to your landing page.
What you can do is to contact the website owners, thank them for sharing your infographics, and ask them to add a backlink to your landing page, says Randy.
5. Crunch The Numbers
Don’t forget to make a summary of your results so you can analyze and understand how well your infographic performed. It will help you improve your future marketing efforts.
Need Some Real Estate Infographics Inspiration?
#1. Best Paint Colors for Selling a House

Ok, it’s official: you’re selling. But there’s a whole journey from where you are to handing the keys to the new owners. First, you need to make sure the house is in its best condition and make it look attractive for clients. For this, you need to know which are the best interior paint colors that sell houses like hotcakes. Of course, there are many other ways to boost a house’s curb appeal, from cleaning the gutters to taking care of the lawn.
#2. Home Staging: Can I do it Myself?
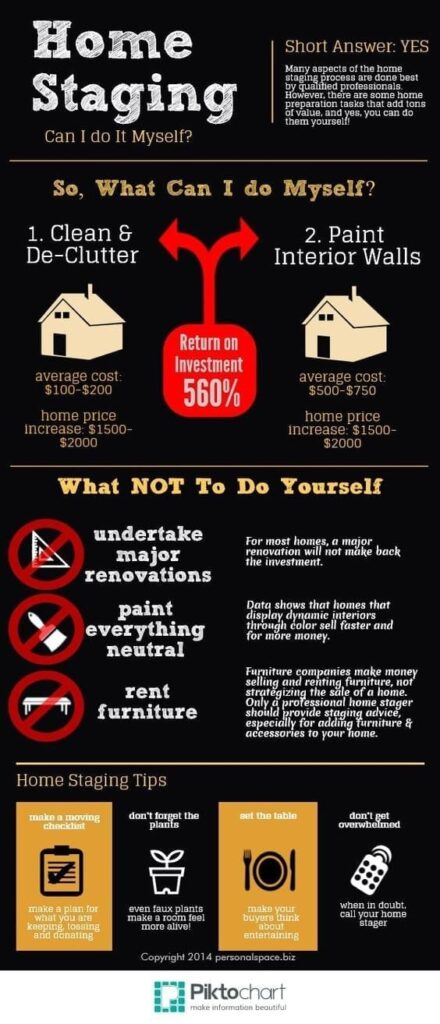
You’re on a budget. We hear you. Luckily, there are some home repairments you can jump on and save some cash. However, some aspects of home staging are best done by professionals and you should definitely know which ones.
#3. 7 Tips Every Homeowner Needs to Know About Home Insurance
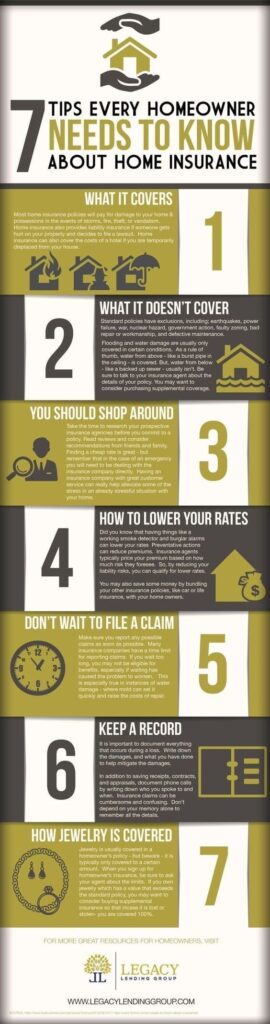
Next move: buying a house insurance. Lesson number one when it comes to buying home insurance: make sure you do your research.
#4. 8 Amazing Apps for Realtors

Technology is making things easy for Realtors— think virtual tours and e-signing, to name a few. Knowing the best apps to save time and sell faster is crucial when you’ve got a lot on your plates.
#5. Explaining Your Closing Costs

People need to know where their money goes to, especially when they make a life investment. It’s true that the buyer covers most of the closing costs, but the seller has a few to pay, too. Transparency is the best approach.
#6. What Does a Home Warranty Cost?
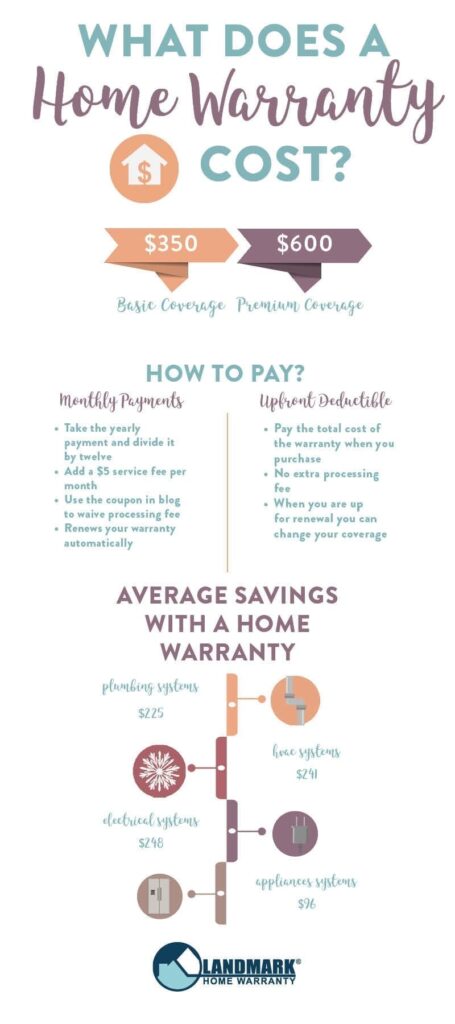
There are several types of home warranties out there, and by explaining the costs, you’re showing buyers you care.
#7. Bang for Your Buck? 5 Worst Home Improvements for Sellers
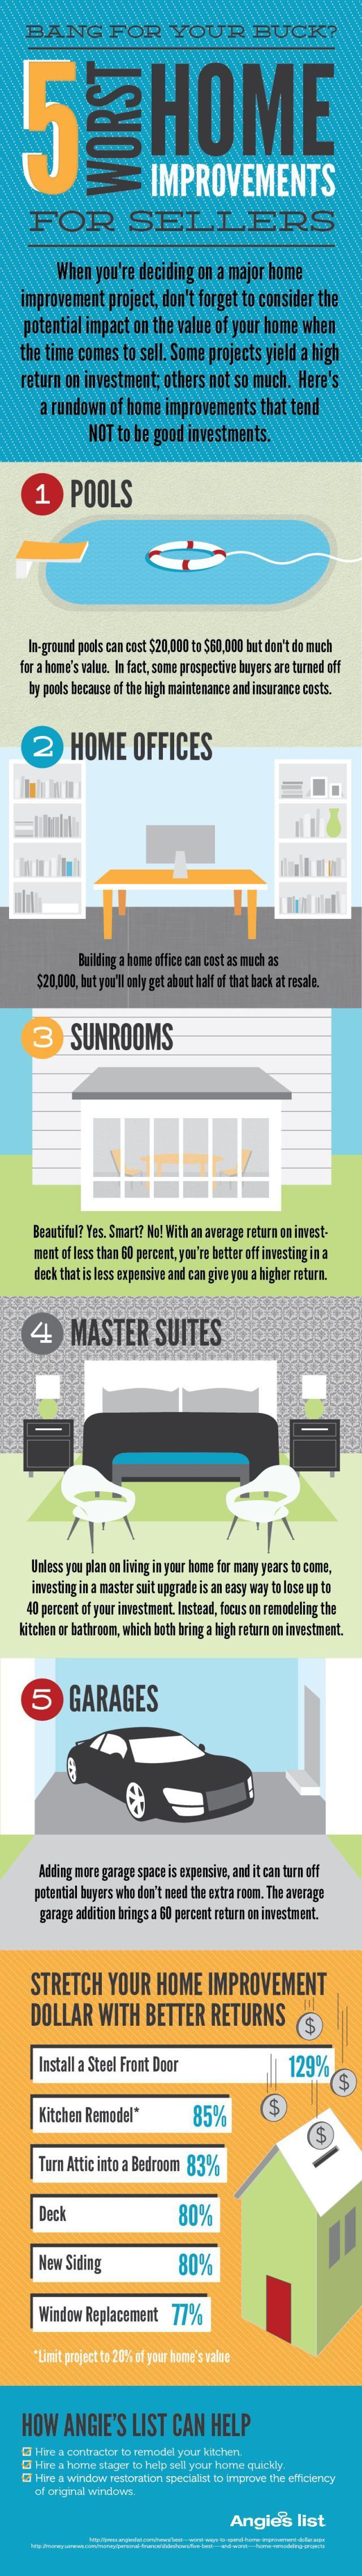
Sellers need to decide on the best home improvements before spending their hard-earned money. Are these works going to improve or detract from your home’s value?
#8. How to Buy a Home With No Money Down and Poor Credit
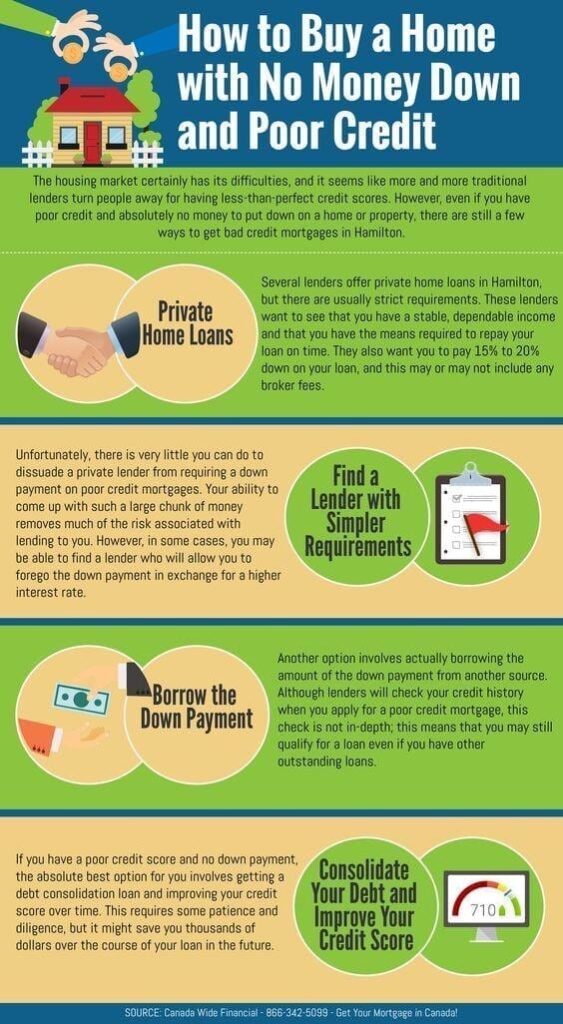
Let’s face it: buying a house it’s a huge investment. It can ruin your bank account, especially when you’re on a budget. This relevant real estate infographic helps people dealing with not-so-perfect credit scores to see their best options.
#9. How to Hire a Contractor

Sometimes, vendors are able to repair stuff on their own. Other times, they need to know they can count on kick-ass contractors. This infographic offers valuable tips on how to master the art of hiring contractors that get the job done.
#10. Rent vs. Buy

The classic debate. Many sellers have nightmares by thinking of whether they should sell or rent. This real estate infographic shows the pros and cons of both operations.
#11. Realtor vs. For Sale By Owner

Explaining to people why they should use a real estate agent makes sense when you’re a Realtor.
#12. To-Do List for First-Time Homebuyers

Buying your first home is BIG. Every first-time buyer has worries and many questions about the whole homebuying process. Covering all the steps not only makes the experience seem easier for the home buyers, but it also shows you as human.
#13. 10 First-Time Homebuyer Mistakes
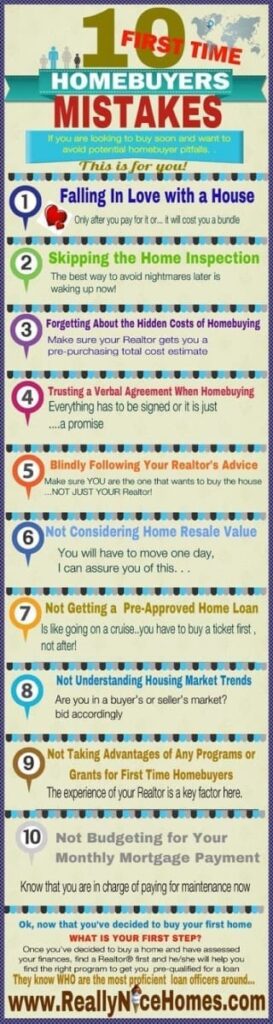
Speaking of first-time homebuyers, the pressure is on. Creating these infographics will send the message that they can count on you as someone who wants to help them make the best moves.
#14. Home Improvements that Pay Off
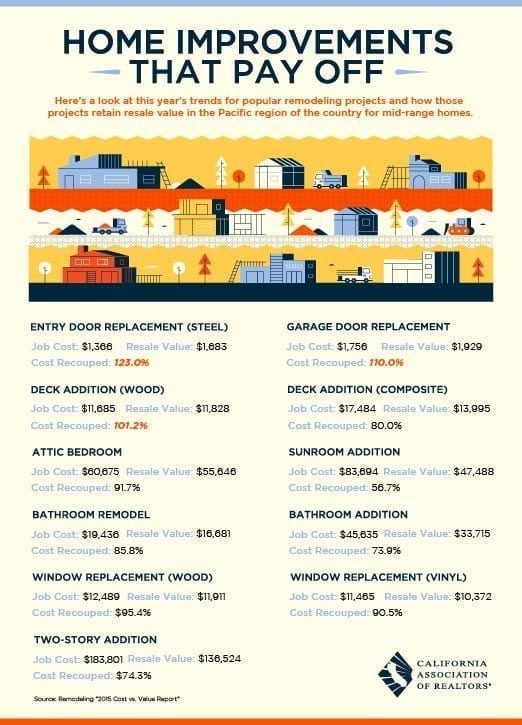
This is one piece of information both sellers and buyers are interested in. Nobody wants to make a bad investment since remodeling projects can turn out to be pretty expensive.
#15. How Proximity Affects Home Value

Location is key when it comes to home purchases and showing the best attractions in the neighborhood is valuable information to use for your next real estate infographic.
#16. 5 Of The Most Common Real Estate Photography Mistakes
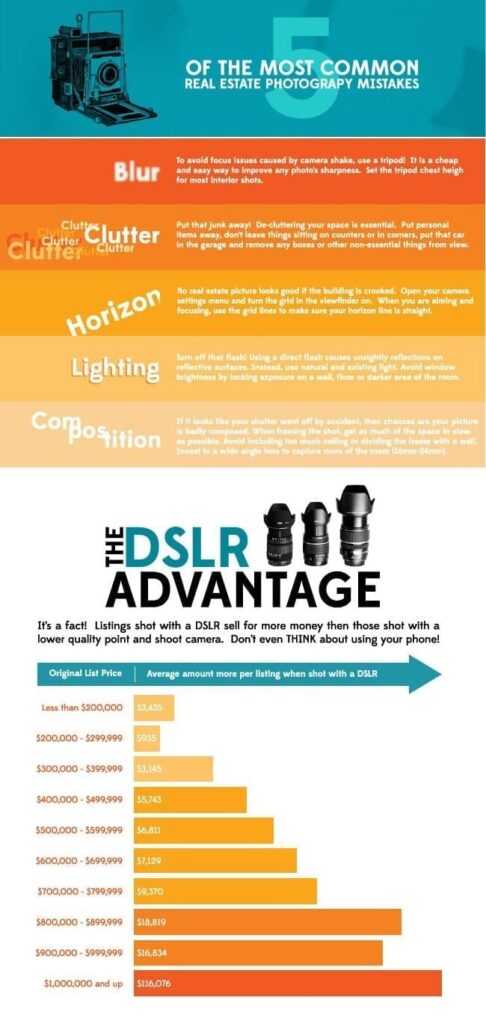
Successful Realtors know one of the secrets to selling houses is investing in professional equipment. A real estate infographic that tells the facts right how they are.
#17. The Keys to A Succesful Open House

There are definitely some important DOs and DONTs when Realtors organize an open house. This infographic is an insightful way to show real estate agents how to make the best out of them.
#18. Living Large In Small Spaces

Knowing how to use space limitations and turn them to your advantage is something we should all take advantage of.
#19. Who is the Typical REALTOR®?
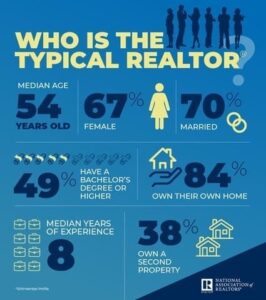
A smart example of sharing real estate statistics from The National Association of Realtors.
#20. Top 5 Most Popular Areas for Millennials

In this day and age, Realtors who don’t stay informed with the pulse of the market won’t make it. Here’s how you create a real estate infographic that shows the most popular places where target consumers plan to move.
#21. Home Buyer & Seller Generational Trends 2019
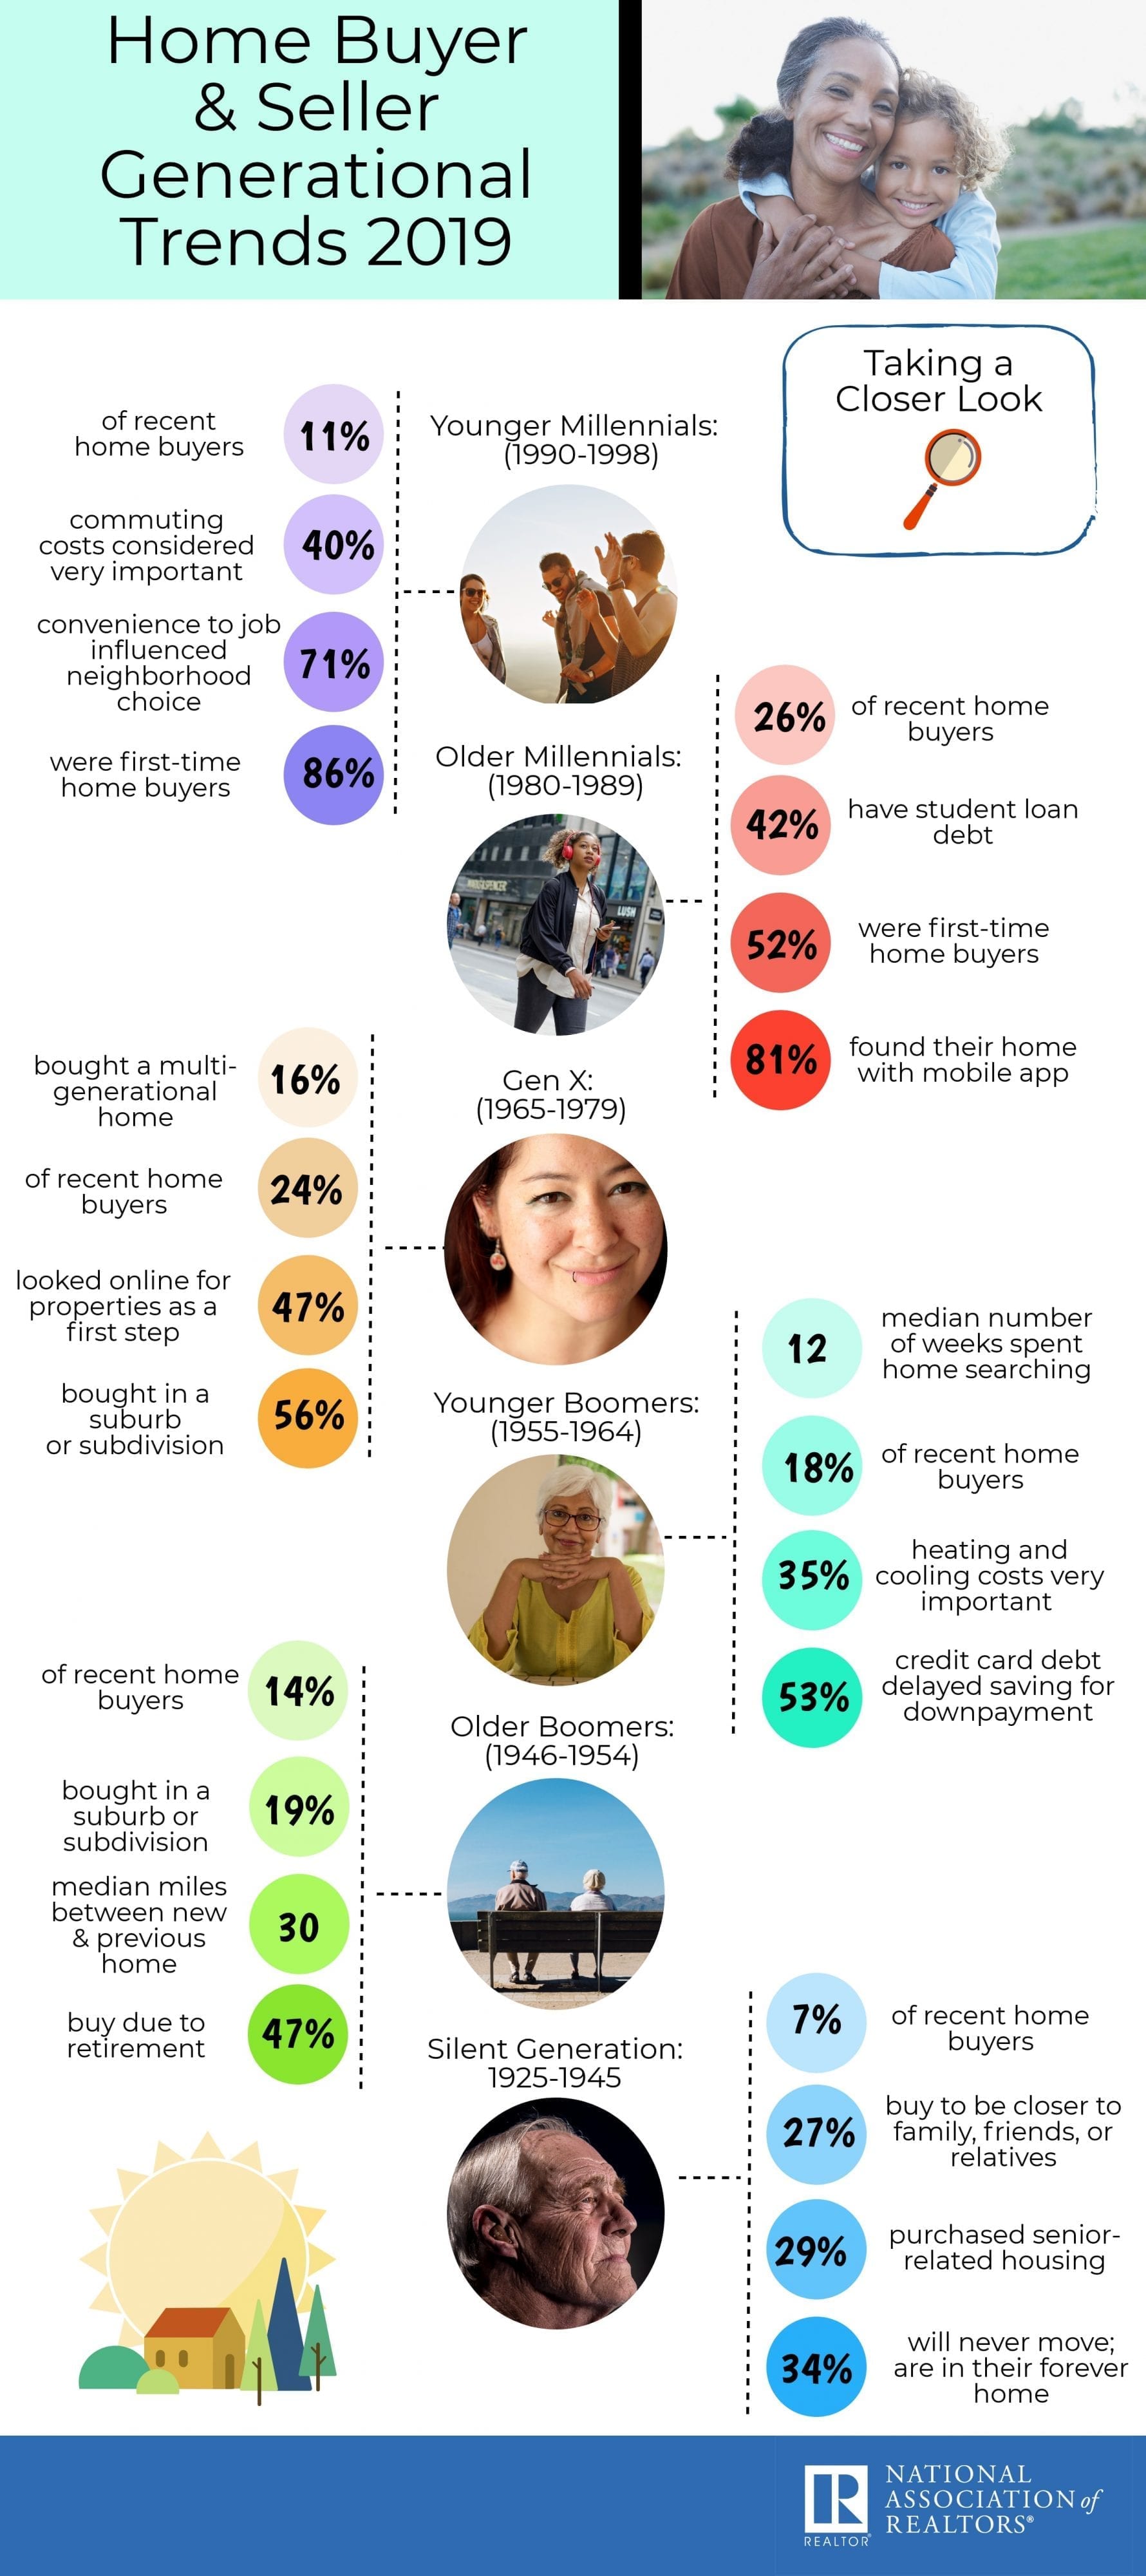
Those who are successful in the real estate world know they need to embrace change and prepare for the upcoming trends. This is truly a useful real estate infographic.
#22. 2019 Remodeling Impact Report: D.I.Y.
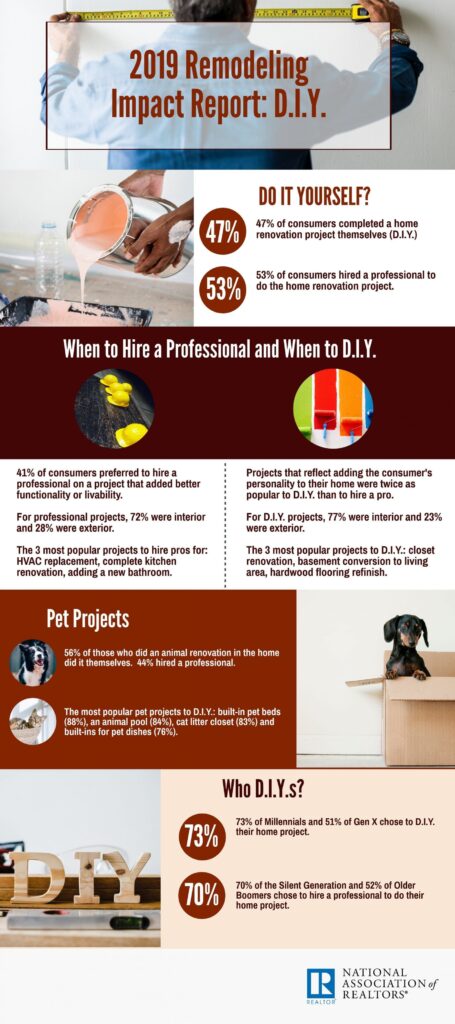
Another way to create relevant infographics that readers love is to combine information from official reports and present it in a visually appealing format.
#23. REALTORS® & Technology

According to The Residential Specialist Magazine, “the latest technology can help you find buyers, market to sellers, organize your office and maybe even lower your blood pressure. The cutting edge has never been so sharp.”
Now let’s see how to create your own real estate infographics and get you the high traffic you’re looking for.
How to Create Real Estate Infographics In No Time
Infographics are great and all, but how do you actually make one?
“We are seeing a huge uptick in agents recognizing the value in using professionals for all their visual marketing needs—virtual staging, drone video and photography, virtual tours, interactive floor plans and more. Hiring the pros to help will continue to be less of a “nice to have” and more of a “must-have” for agents, homeowners and home seekers alike. – Brian Balduf, VHT Studios
We have to agree with Brian. Infographics seem easy and all, but real estate graphic design calls for a creative expert, thinks Graphic Designer Rob Garza. If “there is a major difference from a $25 logo you purchased from an online site and one that has been customized for you and your businesses,” the same goes for infographics.
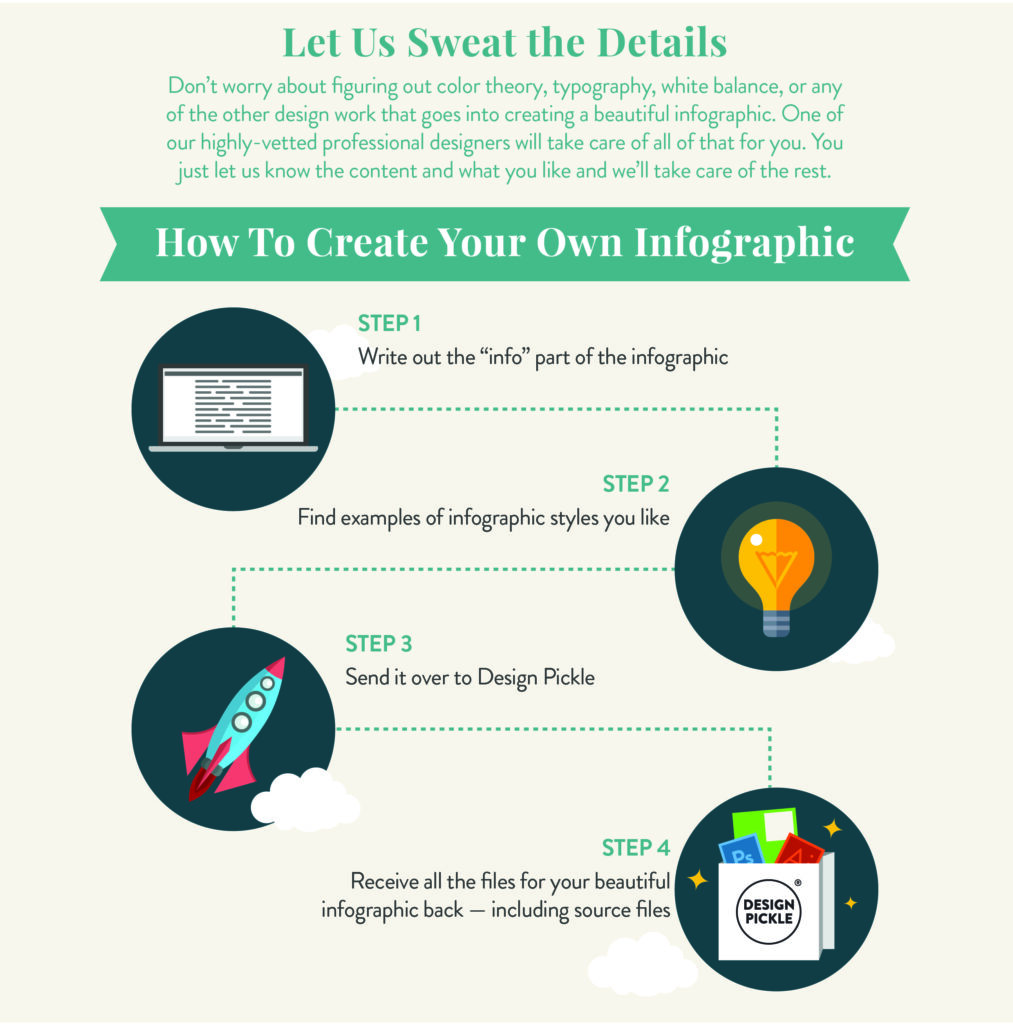
With Design Pickle, you get instant access to a professional designer ready to jump into your creative ecosystem. The process is super simple. You’ll need 3 things to create your infographic:
- The copy and data you’d like to include
- Links or infographics files you like for inspiration
- A Design Pickle Account (recommended but optional—you can always purchase a single design)
Once you’ve assembled these three items, simply pass this information on to your designer. You can do this through our handy Jar application which will walk you through the process of creating your project brief.
After that, your designer will check it over and ensure they have all the information they need. Then, within a few days (depending on the complexity of your request), you’ll receive all of your files back.

There’s no need to worry about white space, aligning graphics, drop shadows, image masking, font pairing, or any other details that go into creating a unique, non-templated infographic.
Tips On Creating Engaging Real Estate infographics
As it turns out, infographics aren’t just buzz words. They are valuable graphic tools you can use in your marketing strategy to promote your business and—why not—sell more homes. Internationally best-selling author, Bernard Marr, wrote an entire post on why we should use infographics that directly speak to your target audience, and we’re sharing his tips with you.
#1. Keep It Simple.
This is honestly the best advice one can give, especially when it comes to graphic design. “Don’t go overboard on flashy graphics and 3D effects—it has to be easy to understand, and the message of every element of the graphic should be immediately obvious,” says Bernard.
#2. Make It Clear
“Make sure the message […] is what jumps out— not the methodology or quality of the graphic design,” adds Bernard. At Design Pickle, we not just create clear and concise infographics, but we also make sure the graphic design is the highest quality.
#3. Make The Best Use Of Space
You don’t want to make them too long or too short, nor too crowded. Think about proportionality, because “brevity is key when you are trying to keep hold of an audience’s attention,” according to Bernard.
#4. Be a Storyteller
The best way to put up a helpful real estate infographic is to “intelligently order the information in a way that will engage the audience.”
#5. Juxtapose
Sometimes, graphic design is about seeing the bigger picture, so Bernard’s advice is to “give careful thought to how elements relate to each other,” so that your audience gets the message.
Over To You
Have something else other than an infographic you need help with? Check out what other kinds of work we can create for your business to visually set you apart from your competitors.
Here are some other inspiration posts to check out:
- Real Estate Flyer Design Inspiration
- Your Holiday Design Checklist
- T-shirts, social media graphics, and business cards